


Warehouse KPIs: The Complete Guide to Key Performance Indicators
Discover the most important warehouse KPIs — from receiving to shipping — with formulas, benchmarks, and tips to boost efficiency, accuracy, and space utilization.
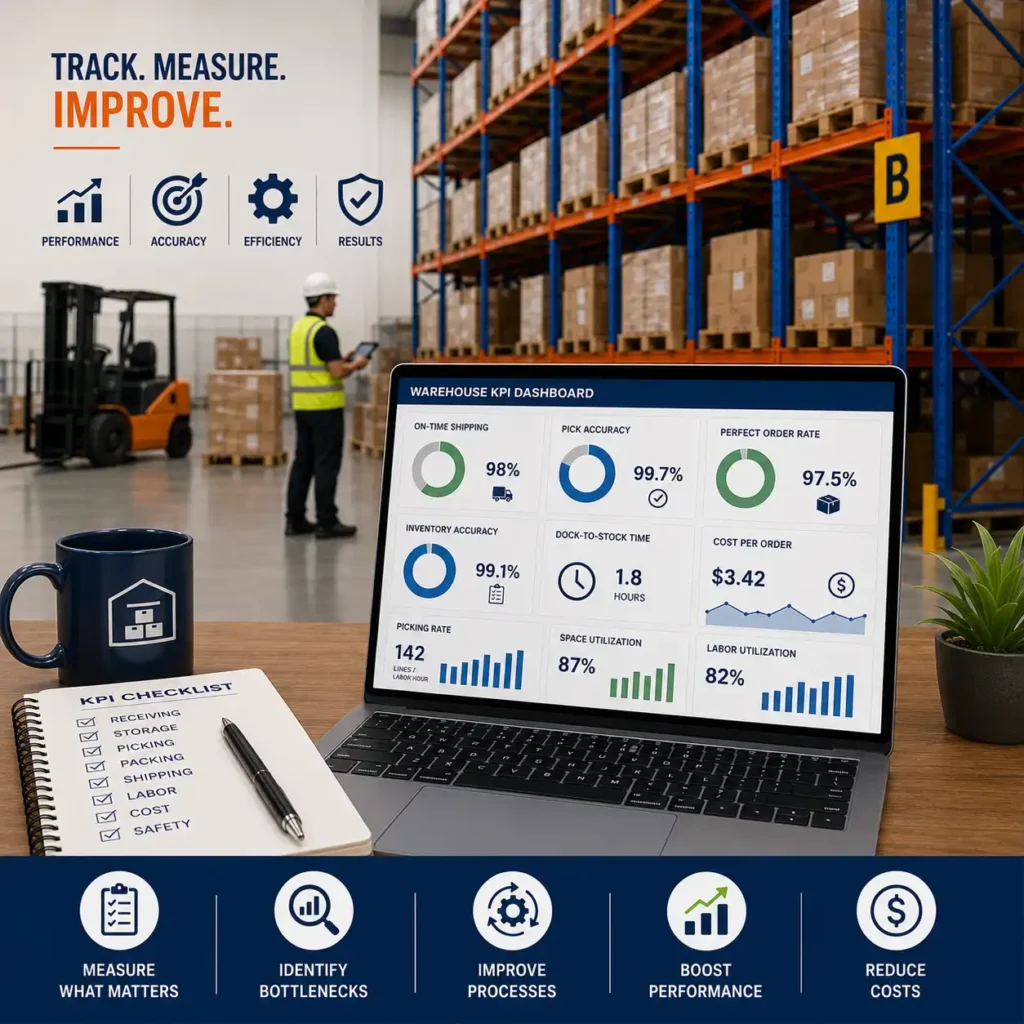
URL Slug: /blog/warehouse-kpis-guide Running a warehouse without tracking KPIs is like driving with the windows painted over — you might still get somewhere, but you won’t know how fast you’re going, how much fuel you’re wasting, or when you’re about to hit something. Warehouse KPIs (key performance indicators) give you that visibility. They turn day-to-day activity — receiving, storing, picking, packing, and shipping — into measurable numbers you can act on.
In this guide, we’ll break down the most important warehouse performance metrics, organized by workflow stage, along with formulas, benchmarks, and practical tips to help you identify bottlenecks and improve efficiency across your operation.
What Are Warehouse KPIs?
Warehouse KPIs are measurable data points that show how effectively a warehouse or distribution center is performing across its core functions: receiving, put-away, storage, picking, packing, shipping, and labor management. Unlike raw data (like “500 orders shipped today”), a true KPI is tied directly to a business objective — for example, “on-time shipping rate” tells you whether you’re meeting customer commitments, not just how busy you were.
It’s worth noting the distinction between metrics and KPIs: all KPIs are metrics, but not all metrics are KPIs. “Packages shipped” is a metric. “Perfect order rate” is a KPI, because it’s tied directly to customer satisfaction and operational health. Most experienced warehouse managers recommend tracking somewhere between 8 and 12 core warehouse management KPIs — enough to get a full picture without drowning in dashboards nobody looks at.
Why Warehouse KPI Tracking Matters
Monitoring the right key performance indicators for warehouse operations helps you:
- Spot bottlenecks in receiving, picking, or shipping before they escalate
- Reduce operating costs by identifying waste in labor, space, or process time
- Improve order accuracy and customer satisfaction
- Make data-driven decisions on staffing, layout, and automation investment
- Benchmark performance against industry standards
- Justify capital investment in racking, shelving, or automation upgrades
Let’s walk through warehouse KPI examples by workflow stage, since that’s how most operators structure their tracking.
Receiving KPIs

Receiving is where inbound goods enter your operation, and errors here create a ripple effect through every stage that follows.
Put-Away KPIs

Put-away measures how efficiently received goods move from the dock into their storage locations.
Storage and Inventory KPIs

This category covers how well you’re using your physical space and how reliable your inventory data is.
This is also the category where your physical infrastructure has the most direct impact. Poor space utilization and storage productivity numbers are frequently a racking and shelving problem, not a process problem — a warehouse using standard selective racking at 60% vertical capacity, for instance, will always underperform one using high-density or long-span systems designed for its actual SKU profile.
Picking KPIs

Picking is where labor cost and order accuracy intersect most directly.
✓ Pick Accuracy – The percentage of order lines picked correctly on the first attempt.
Packing KPIs

Shipping and Distribution KPIs

✓ Order Cycle Time – Total time from order placement to dispatch, covering picking, packing, and staging.
Labor Productivity KPIs

✓ Units per Labor Hour – Total units handled divided by hours worked, a broad productivity benchmark.
✓ Labor Utilization Rate – The percentage of paid labor hours spent on productive, value-adding tasks.
✓ Overtime Cost – Total overtime hours multiplied by the overtime rate, useful for tracking whether staffing levels match demand.
Cost KPIs

✓ Cost per Order – Total fulfillment cost (labor, packaging, storage, overhead) divided by number of orders. This is often described as the truest profitability KPI, since rising order volume doesn’t always mean rising efficiency.
✓ Warehouse Throughput – The rate at which goods move through the facility, useful for identifying bottlenecks across receiving, storage, and shipping combined.
Warehouse Safety KPIs

Safety metrics protect your people and your operation’s uptime.
✓ Total Recordable Incident Rate (TRIR) – The number of work-related injuries per 100 full-time workers annually, a standard metric used to benchmark safety performance.
✓ Near-Miss Reporting Rate – Tracks close calls before they become injuries, giving you a leading (not just lagging) safety indicator.
✓ Safety Training Completion Rate – The percentage of staff current on required safety training.
Ecommerce and 3PL Warehouse KPIs

Fast-growing operations, especially those supporting online order fulfillment or acting as a third-party logistics (3PL) provider, often layer in additional metrics:
✓ Channel-Specific Fulfillment Rates – Comparing performance across direct-to-consumer, wholesale, and marketplace channels.
✓ Returns Processing Efficiency – How quickly and accurately returned items are inspected, restocked, or dispositioned.
Warehouse KPI Benchmarks
Comparing your numbers against industry standards is the fastest way to know if you’re actually performing well or just busy. Some commonly cited warehouse KPI benchmarks:
KPI
Best-in-Class Benchmark
Pick accuracy
99.9%
Dock-to-stock time
Under 2 hours
On-time shipping rate
98%+
Units per labor hour
30–300 (varies by automation level)
Cost per order (standard ecommerce)
$2.50–$7.00
If your numbers fall well outside these ranges, it’s usually a sign that your workflows, layout, or storage systems need a closer look.
Building a Warehouse KPI Dashboard
A warehouse KPI dashboard turns raw numbers into something your team can actually act on day to day. A few practical guidelines:
- Limit yourself to 8–12 KPIs
Tracking too many dilutes focus; tracking too few leaves blind spots.
- Match review frequency to KPI type
Daily KPIs (pick accuracy, on-time shipments) need daily visibility. Labor and cost trends can be reviewed weekly or monthly.
- Make it visible
Teams engage more with performance data when it’s on a shared dashboard or whiteboard rather than buried in a spreadsheet only managers see.
- Tie KPIs to decisions, not just reporting
Every KPI you track should answer a specific question — “should we add a shift,” “should we reslot this aisle,” “should we invest in racking upgrades.”
You don’t need expensive software to start — a simple warehouse KPI template in a spreadsheet, updated daily or weekly, is enough to begin building a performance baseline before investing in a full WMS dashboard.
How Warehouse Layout and Racking Affect Your KPIs
It’s easy to treat KPIs as a purely operational or software problem, but several of the metrics above — space utilization, storage productivity, travel distance per pick, and warehouse throughput — are directly shaped by your physical racking and shelving setup.
A few examples:
- Poor space utilization is often fixed with high-density storage systems (drive-in, push-back, or mobile racking) rather than more square footage.
- High travel distance per pick frequently points to a slotting or layout issue that better-designed racking aisles and pick paths can resolve.
- Low storage productivity in vertical space is a common sign a warehouse hasn't taken advantage of taller racking or a mezzanine floor to add capacity without expanding the building footprint.
If your KPI dashboard is consistently flagging space or throughput problems, it’s worth having your racking and shelving layout reviewed alongside your process — sometimes the fastest fix isn’t a new software system, it’s a better-designed storage structure.
Frequently Asked Questions
There's no single universal answer, but perfect order rate is widely considered the most important composite metric, since it reflects accuracy, timeliness, and completeness all at once — a drop in perfect order rate almost always points to a specific upstream problem worth investigating.
Most experienced operators recommend 8–12 core KPIs. Tracking more than that tends to create noise rather than clarity.
A metric is any measurable data point. A KPI is a metric directly tied to a business objective — for example, "orders shipped" is a metric, while "on-time shipping rate" is a KPI because it reflects a customer commitment.
Daily operational KPIs (pick accuracy, shipping accuracy) should be reviewed daily. Productivity and cost trends are typically reviewed weekly or monthly.
Final Thoughts
Tracking the right warehouse KPIs isn’t about generating more reports — it’s about knowing exactly where your operation is losing time, money, or accuracy, and having the data to fix it. Start with a small, focused set of metrics across receiving, storage, picking, and shipping, benchmark them against industry standards, and revisit your physical layout and racking setup whenever space or throughput numbers stall.
If your KPI data is pointing to a space utilization or throughput problem, it might be time for a layout review. Get in touch with RackPro Shelving for a free warehouse storage assessment and find out whether your racking system is helping — or holding back — your numbers.